
Audio Spectrum Visualizer
A free audio spectrum visualizer that runs in your browser. Watch EQ bars, waveforms, and equalizer rings react to the frequencies in your music in real time, from a classic Winamp-style analyzer to full 3D scenes.
See it in action
Click any preview to run it with your own music
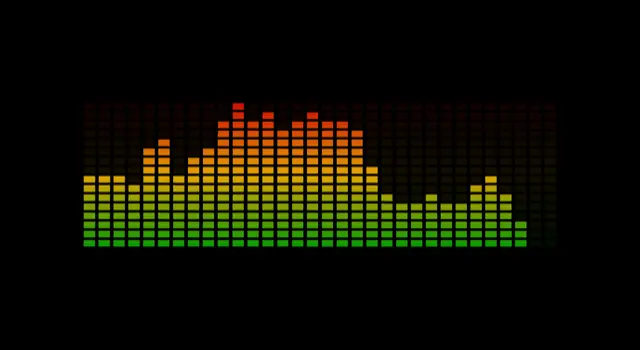
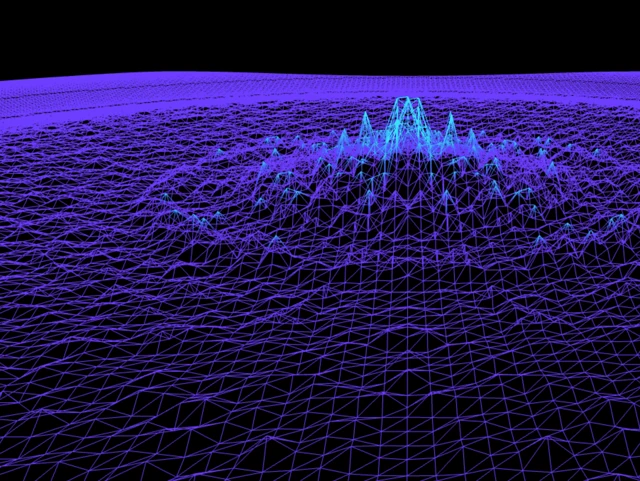
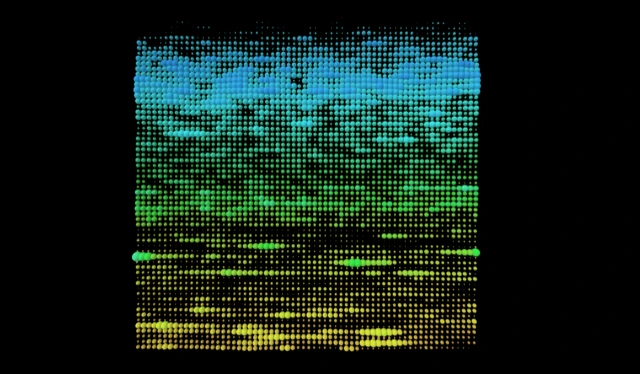
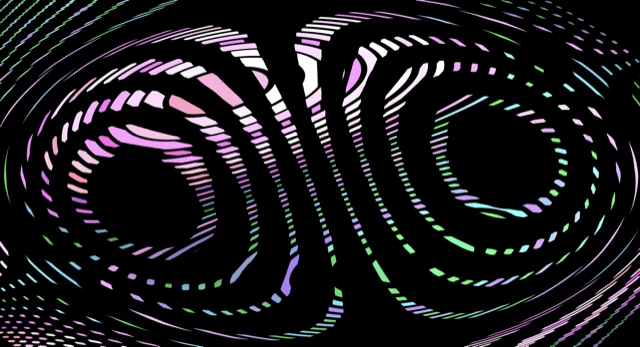
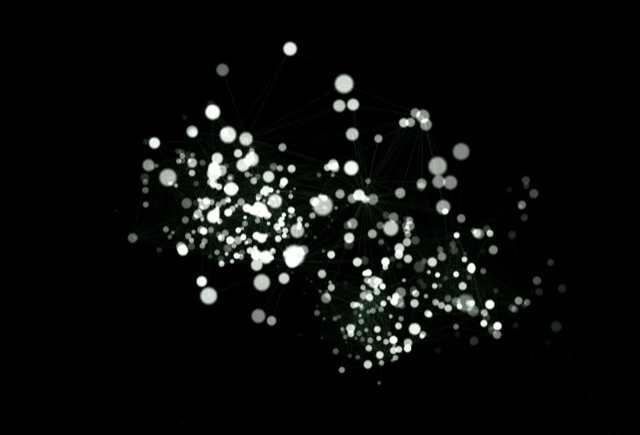
A spectrum visualizer is the original music visualizer: a row of bars, one per frequency band, bouncing with the song. Bass on the left, treble on the right, peak caps hanging a beat behind. It is the view that shipped with Winamp and every stereo receiver of the nineties, and it is still the clearest way to actually see what is in a track.
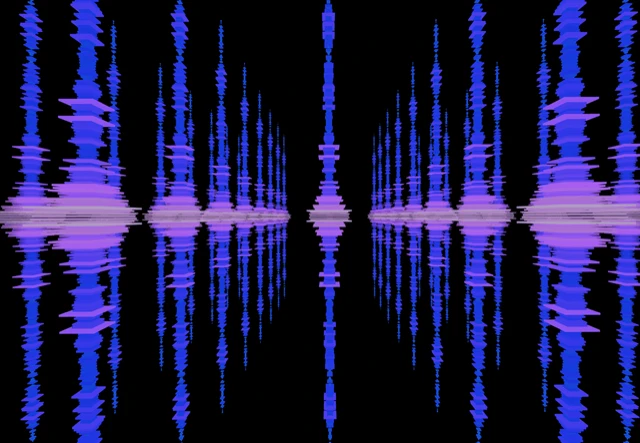
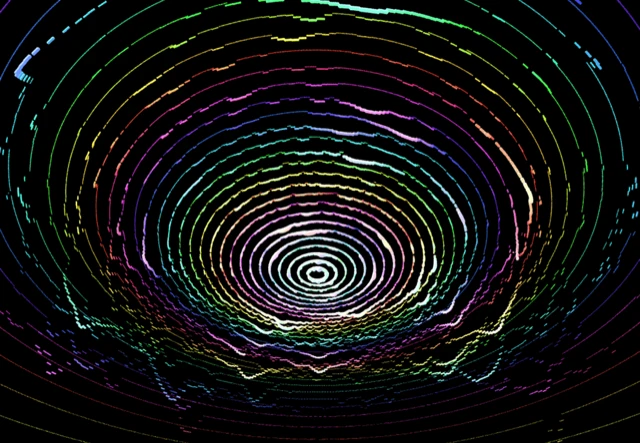
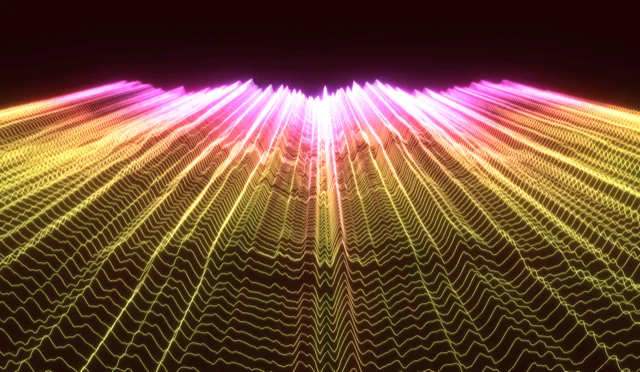
Under the hood, vizz.fm runs a live FFT on whatever is playing, splits the result into frequency bands, and draws it sixty times a second. Classic Spectrum is the straight version: chunky gradient bars, peak-hold caps, an optional mirror and a history wall that scrolls the last few seconds of the spectrum into the distance. From there it gets less literal. Frequency Hallway turns the same bars into a glowing shader corridor, Equalizer Rings wraps them around a sphere, and Wavy Form draws the raw waveform as stacked oscilloscope lines.
What you get
Dozens of visualizers
Particle systems, waveforms, 3D meshes, shaders, reactive spheres, all WebGL-powered and running at 60fps.
Full customization
Every visualizer has its own controls for colors, speed, intensity, and geometry. Tweak everything in real time.
Post-processing effects
Layer kaleidoscope, bloom, CRT scanlines, and more on top of any visualizer for completely unique looks.
Preset system
Save your favorite combinations and switch between them instantly. Great for live use and experimentation.
Audio-driven controls
Wire any slider to respond to bass, mids, or treble. Your visuals become truly driven by the music, not just reacting to volume.
Multiple audio sources
Upload files, use your microphone, stream URLs, or capture system audio from Spotify, YouTube, and more.
Spectrum vs. waveform, and why both are here
A spectrum (or EQ) visualizer shows frequency: how much bass, mids, and treble are playing at this instant. A waveform visualizer shows time: the actual shape of the sound pressure wave, the thing an oscilloscope draws. They are two views of the same audio, and vizz.fm renders both from the same live analysis, so you can switch between a frequency bar display and a scrolling sound wave without changing anything else.
The frequency analysis is also exposed as a control source. Any slider in any scene can be wired to bass, mids, or treble, so a spectrum visualizer here is not just a readout. The bars can drive the camera, the colors, or the geometry of a completely different scene. Smoothing and gain are adjustable too, so you can tune the bars to be twitchy and responsive or slow and cinematic.
Everything is rendered in WebGL at 60fps, directly from the audio as it plays. There is no upload and no render queue. Point it at a file, a microphone, or anything playing on your computer and the spectrum is live on the next frame.
Connect any audio source
vizz.fm works with whatever you're listening to. Upload local files (MP3, WAV, FLAC), use your microphone to pick up room audio, or capture system audio from any app via screen sharing or a virtual audio device.
Use it for anything
Everything happens in real time, so whether you're adding visuals to a stream, performing a DJ set, throwing a party, or just listening to an album in a dark room, vizz.fm turns your music into something you can watch.
Common questions
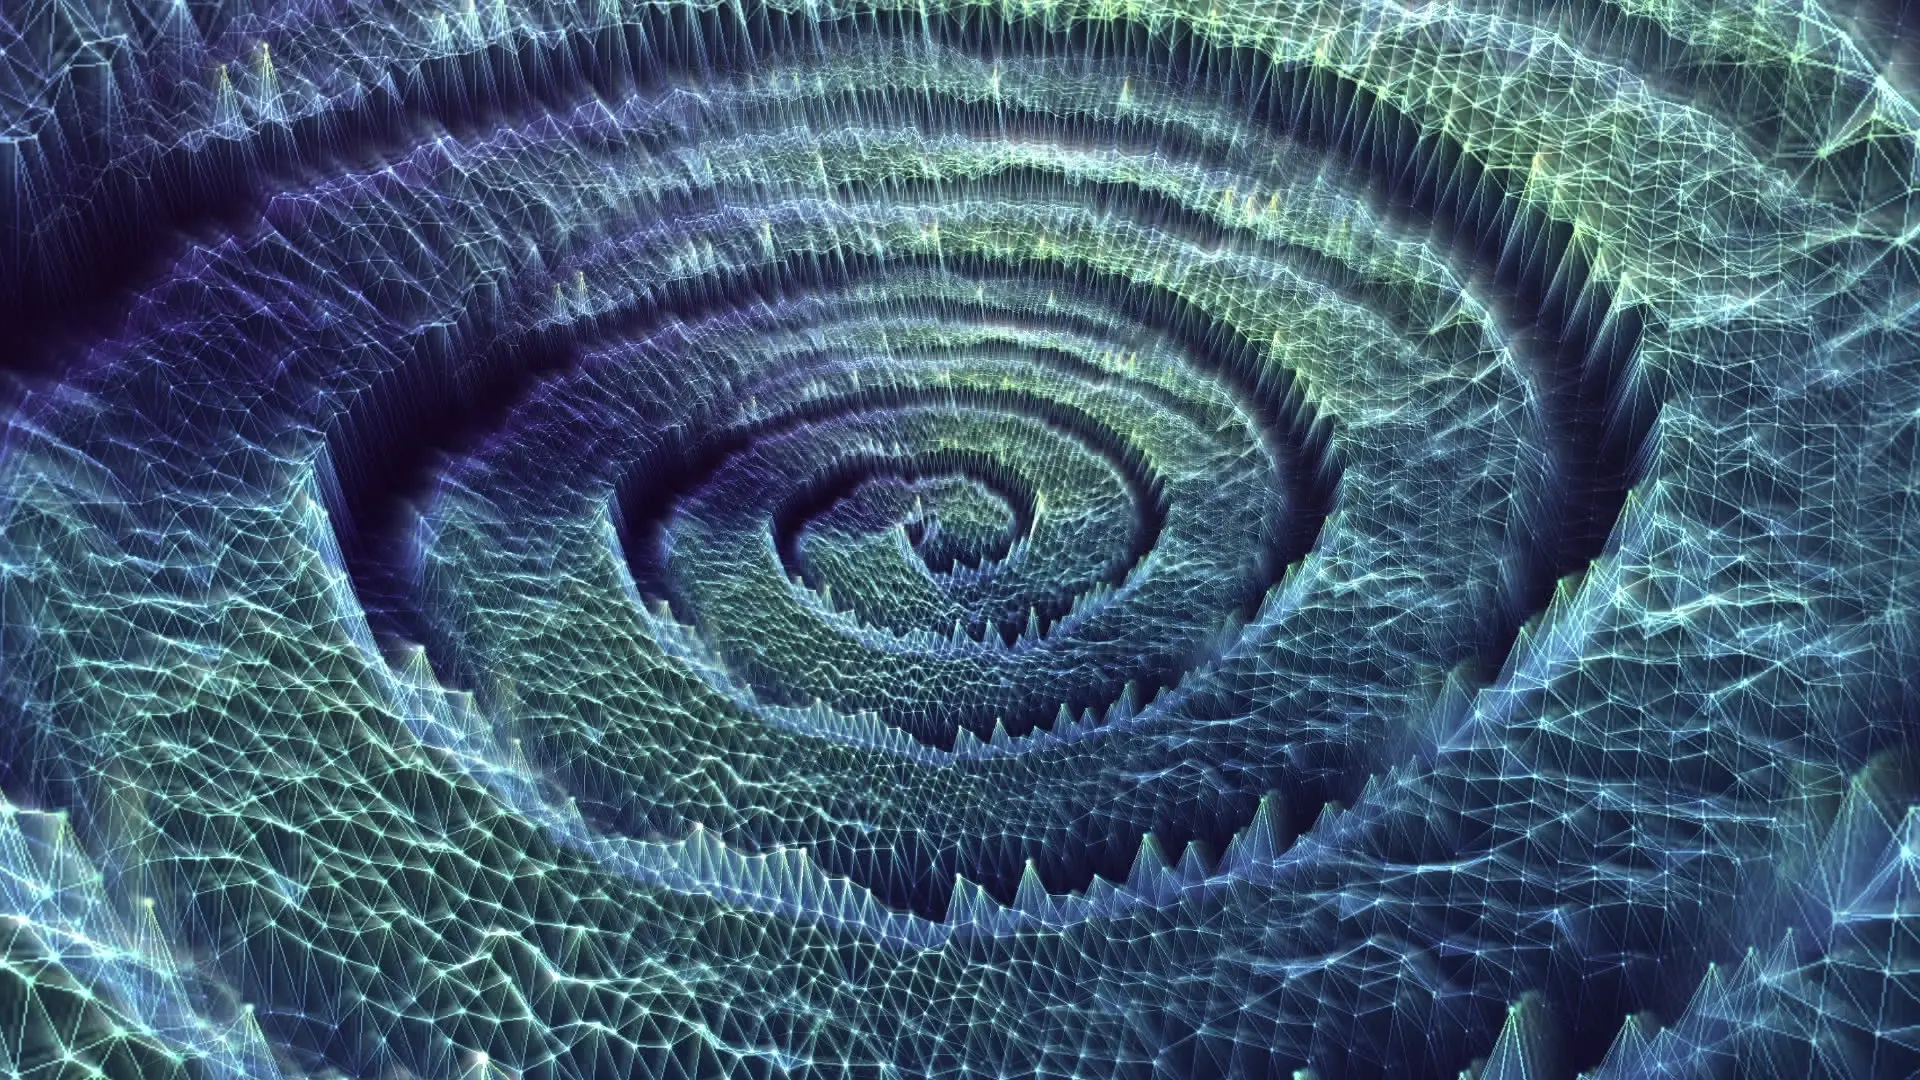
Bars, waves, and rings. Live.
Every frequency band, drawn as the music plays.