Free audio analysis tools in your browser
A spectrogram, spectrum analyzer, oscilloscope, vectorscope, loudness meter and key and BPM finder that are nice to look at. Load a file or share what your computer is playing, and put them up on a second monitor.
Five of the tools on one screen.
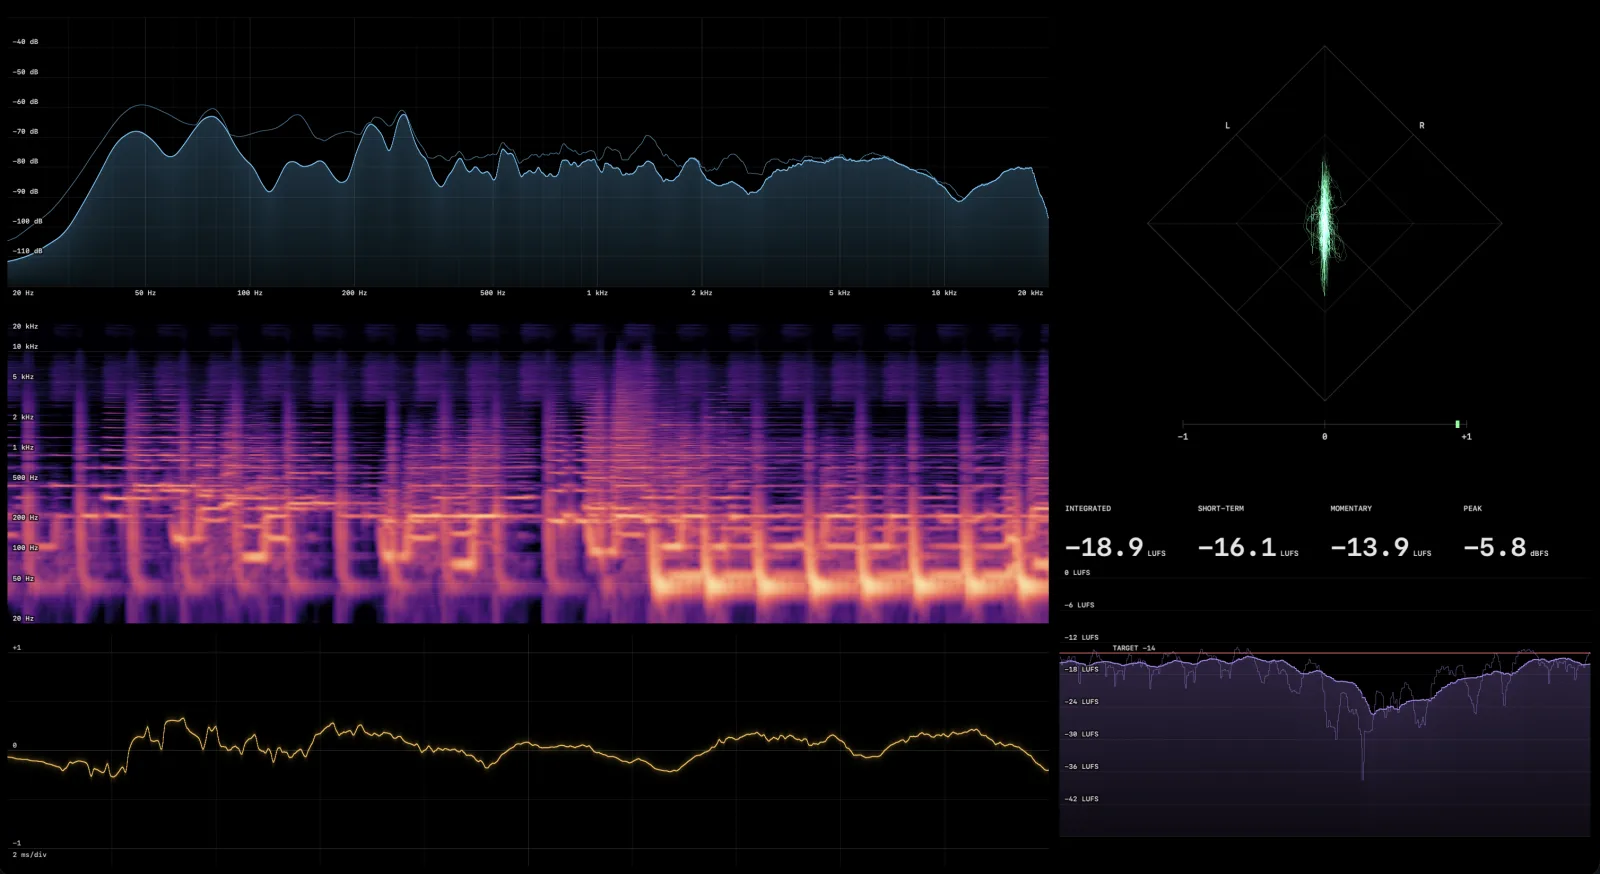
Metering tools tend to be small gray windows tucked in a corner of a DAW. These are the same displays drawn full screen, with the care that goes into the rest of the visualizer: sharp traces, readable axes, and controls for color, range and scale on every one. Each tool below opens on its own, or open the dashboard to see the first five together.
Online spectrogram
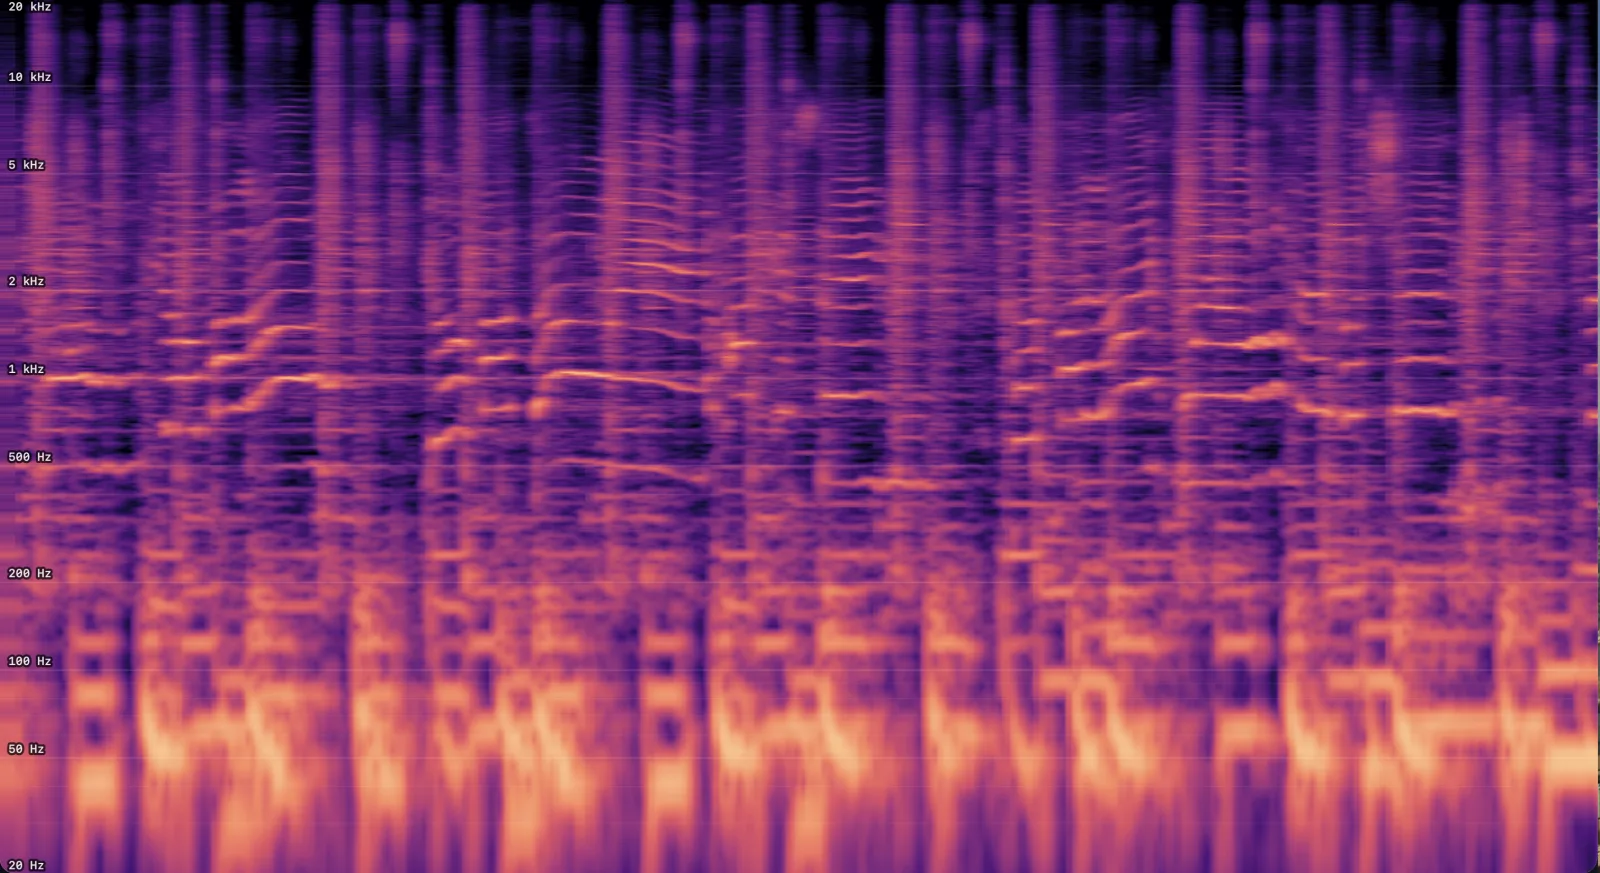
A spectrogram draws frequency against time. Low notes sit at the bottom, highs at the top, and the picture scrolls sideways as the track plays, with brighter color wherever there is more energy. The frequency axis is logarithmic, the way pitch is heard, and can be labeled in Hz or in note names.
It is the display to reach for when you want to see what happened, not only what is happening now. A resonance shows up as a bright horizontal line that never goes away. Hiss is a haze across the top. A filter sweep is a diagonal, a kick is a column at the bottom, and a vocal is a stack of wavy harmonics. Set the time window anywhere from 2 to 30 seconds, zoom the frequency range in on the low end, and raise the noise floor to hide everything but the loud parts. Point at any spot to read its frequency, its level and how many seconds ago it played. There are five color maps, and a 3D waterfall control lifts the same picture into a surface, where level becomes height.
Online spectrum analyzer
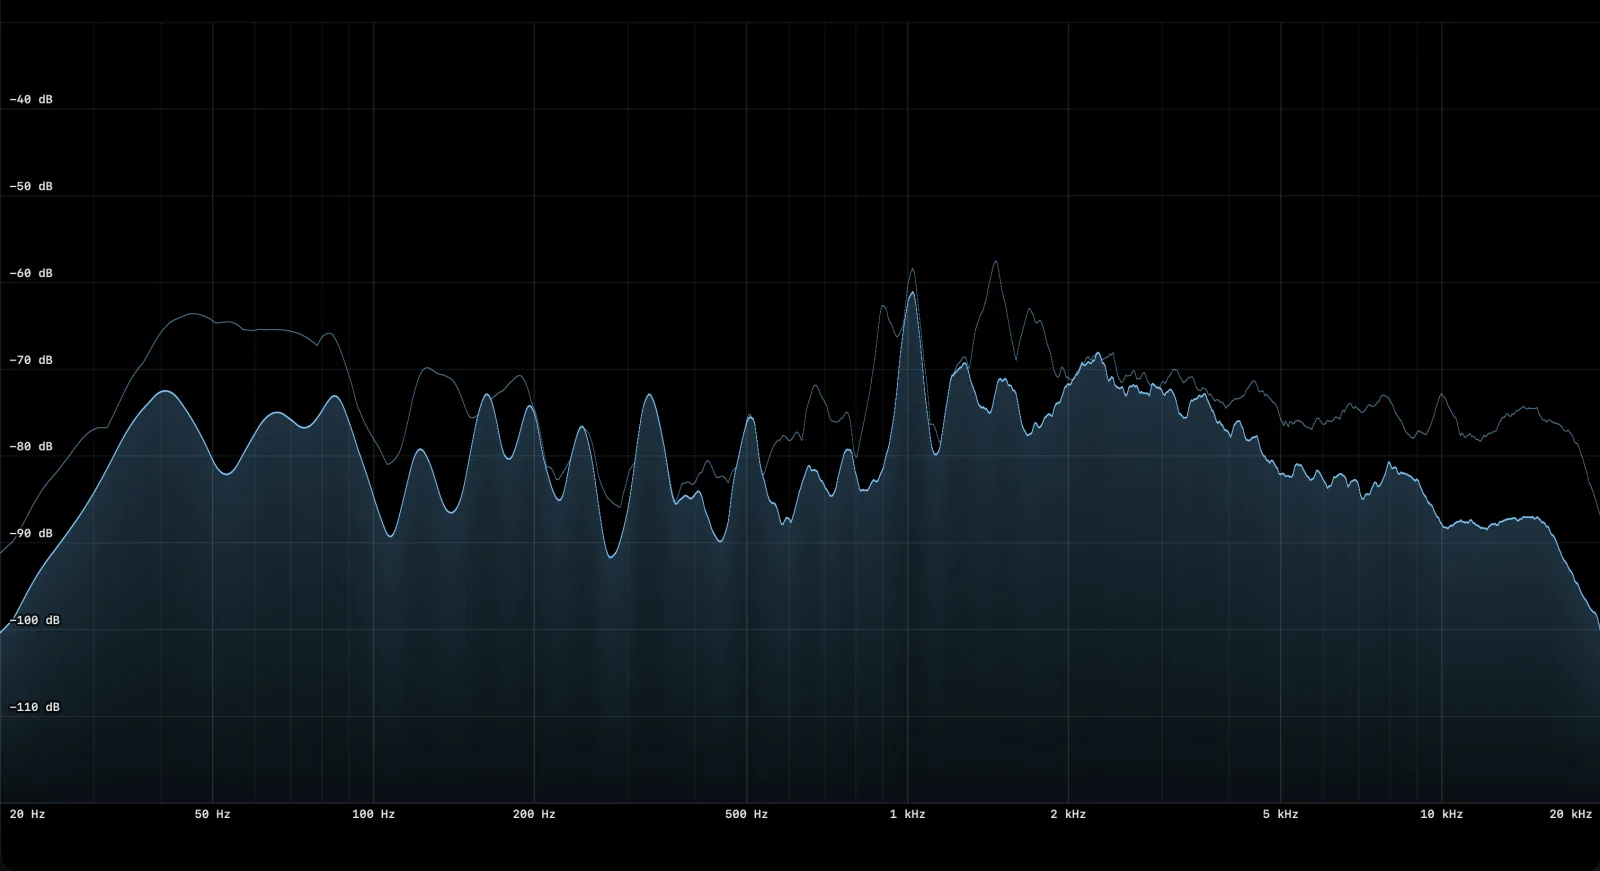
A spectrum analyzer shows how loud each frequency is at this instant: a live curve from 20 Hz to 20 kHz against a dB scale. Peak hold leaves a second line at the highest level each frequency has reached and lets it fall back slowly. The display can be a smooth curve or 1/3 and 1/6 octave bars, and pointing at it reads out the frequency and level under the cursor.
Use it to check tonal balance. Play a reference track, hold a snapshot of its curve, then play your mix against it: too much around 200 to 300 Hz, a missing top octave and a sub that is louder than it sounds on small speakers are all easy to spot. Averaging, over up to 30 seconds or the whole track, shows the long-term balance instead of the moment. Tilt (in dB per octave) leans the display so a balanced mix reads roughly flat instead of sloping down to the right. Smoothing averages the curve over a fraction of an octave, so you can read the overall shape or turn it down and look at individual harmonics.
Online oscilloscope
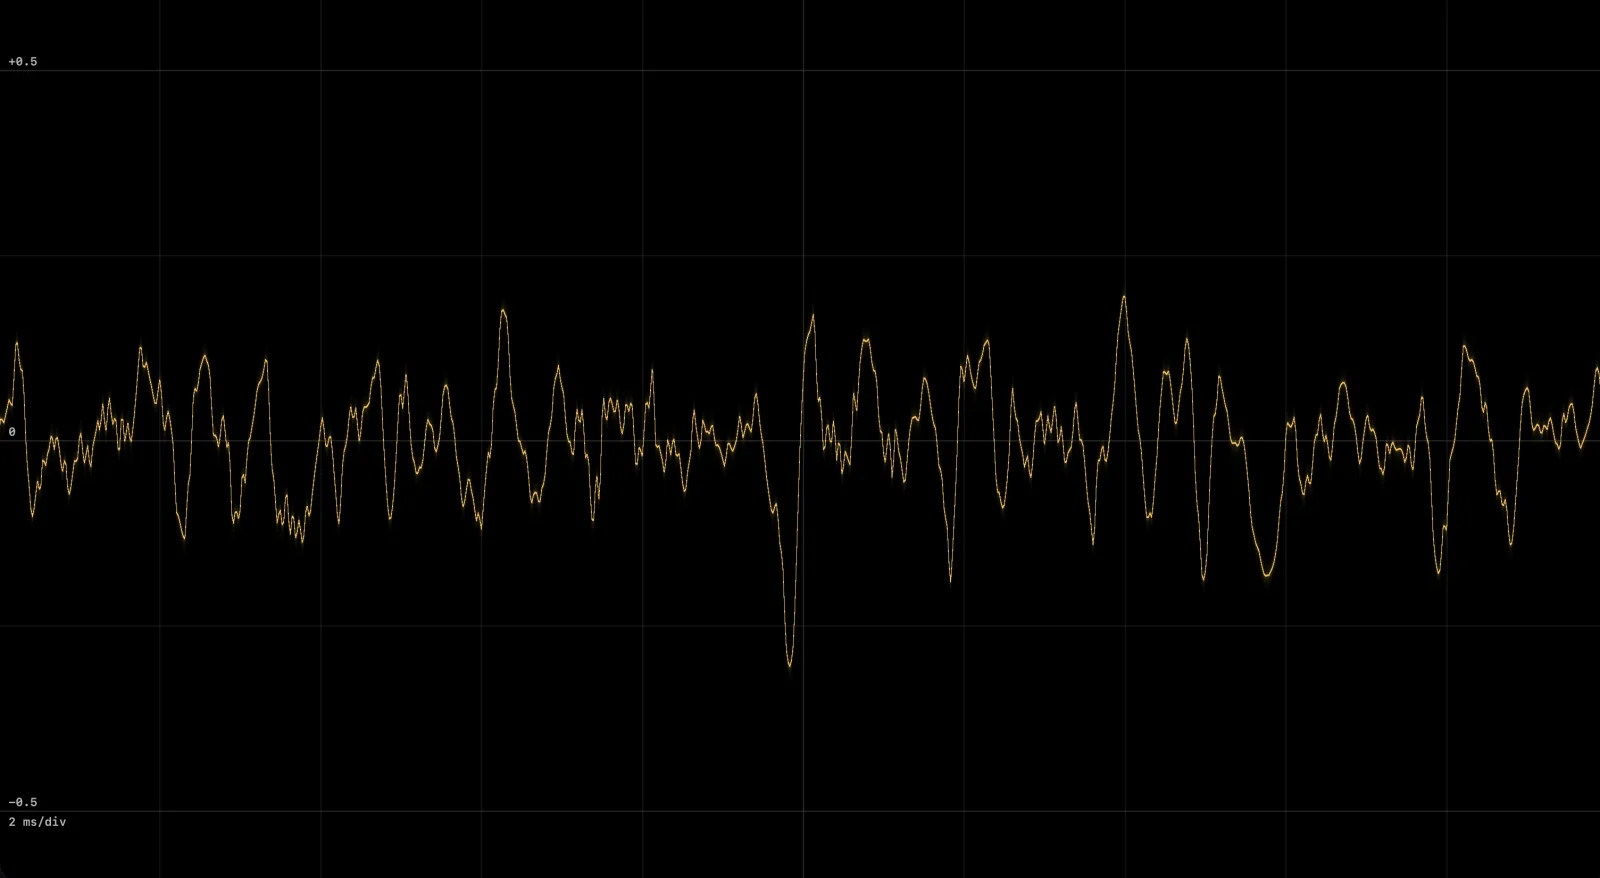
An oscilloscope draws the waveform itself: level against time over a window of 1 to 40 milliseconds. This one is triggered, which means each frame starts at the same point in the wave, so a steady tone stands still on screen instead of sliding around. The trigger follows the fundamental, not every high-frequency wiggle on top of it.
It is the quickest way to see the shape of a sound. A sine, a saw and a square are obvious at a glance. So is what a filter, a wavefolder or a distortion pedal does to them, and so are flat tops where something is clipping. Turn on the peak readout and the full-scale lines flash red whenever a sample clips. Synth programmers use it to watch a patch change as they turn a knob.
Online vectorscope and correlation meter
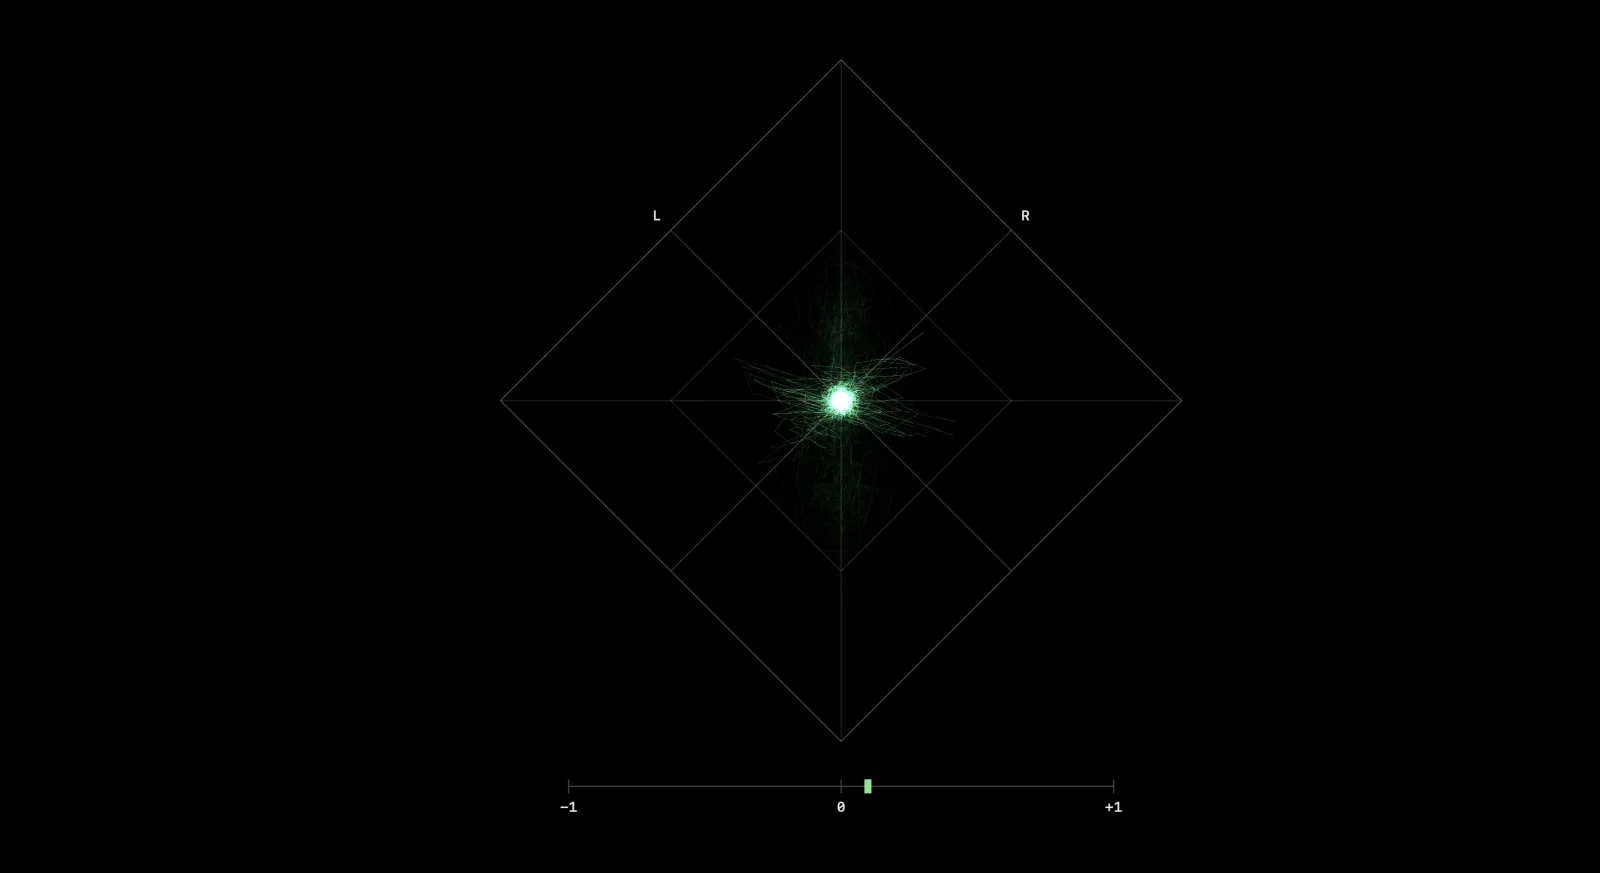
A vectorscope plots the left channel against the right, so the picture is the stereo field. A mono signal is a straight vertical line. The wider the mix, the more the shape spreads out to the sides. Draw it as dots or as a connected beam, with adjustable persistence.
The correlation meter underneath turns that picture into one number. Near +1 the two channels are almost identical. Around 0 they are unrelated, which is what a wide mix looks like. Below 0 they are working against each other, and whatever is causing it will get quieter or vanish when the track is summed to mono on a phone speaker or a club system. If the shape leans horizontal and the meter sits in the negative, check your stereo wideners and the phase of anything recorded with two microphones. A second marker shows the correlation of the low end alone, below 150 Hz, where cancellation costs the most, and a balance readout shows how many dB the mix leans left or right.
Online LUFS loudness meter
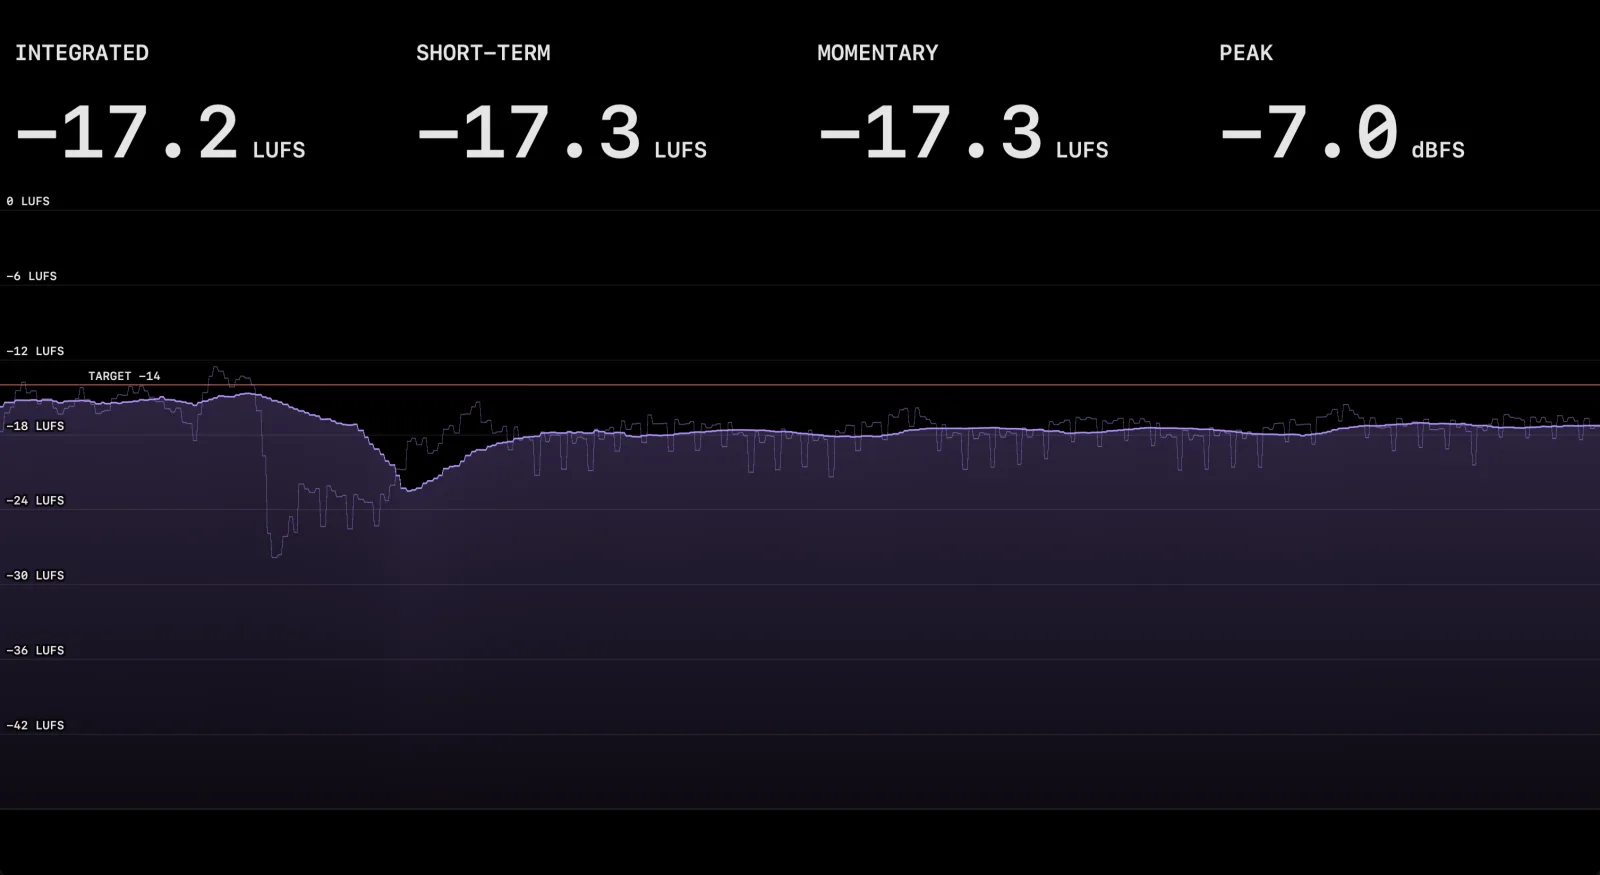
LUFS is the measure of loudness that streaming services use when they turn tracks up or down to match each other. The meter shows three of them, following the ITU-R BS.1770 method: momentary (the last 400 ms), short-term (the last 3 seconds) and integrated (the whole track so far, ignoring silences). It also shows loudness range (how far apart the loud and quiet sections sit), true peak, and a scrolling graph of the last 10 to 120 seconds.
A target line sits at -14 LUFS, about where Spotify and YouTube normalize. Presets move it to Apple Music (-16), broadcast (-23 and -24) or a club master (-8), or set it anywhere from -30 to -4. The integrated readout shows how far the track is from the target, so play it from the start and read that number at the end to know how much a service will turn it down. Watch short-term through a chorus to see how far the loud sections sit above the quiet ones. Reset the integrated reading before each pass.
Online key and BPM finder
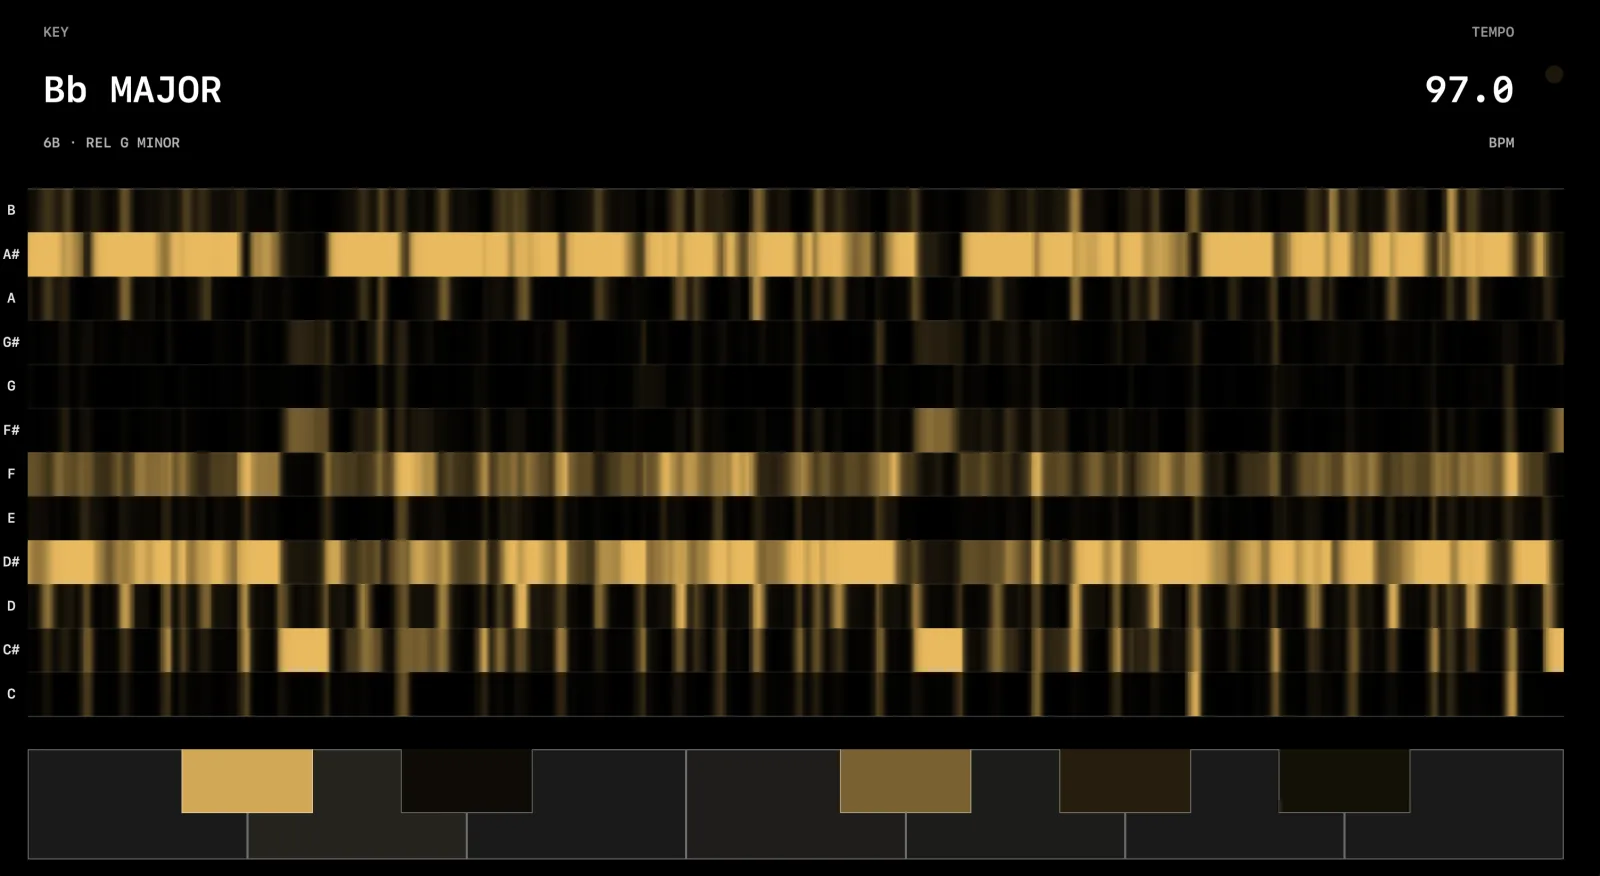
A key and BPM finder listens to a track and names its key and tempo. The readout shows the estimated key, its Camelot code, the relative major or minor, and the BPM to one decimal place, with a dot that pulses on the beat. DJs use the Camelot code to pick the next track: the same number, or one step either side, mixes without clashing. Producers use it to find the key of a sample before writing over it.
Underneath is a chromagram, which shows where the answer comes from. It has one row for each of the twelve notes, scrolling over the last 4 to 60 seconds, and a row is brighter when that note is sounding in any octave. The notes of the key show up as steady bands, a chord change is a step from one set of rows to another, and the piano strip at the bottom lights the notes playing right now. Key memory sets how many seconds of music the estimate listens back over: short follows a modulation quickly, long holds steady through a passing chord. If the tempo reads at half or double what you expect, narrow the tempo range.
What these are for
These are for looking at audio from outside the session: a second monitor showing the whole mix while you work, a quick check of a bounce or a reference track, a way to learn what each display is telling you, or something good to have on screen while music plays.
They are not a replacement for the metering plugins inside a DAW. Audio shared from another app arrives in the browser a moment late, and the readings are close, not certified. When a number has to be exactly right, such as a loudness spec for a delivery, confirm it with a dedicated meter.
Common questions

See what your mix is doing.
Open the dashboard and play something.