What happened to music visualizers?
Twenty years ago, every music player came with one. Windows Media Player had Alchemy, iTunes had its swirling color fields, Winamp had Milkdrop. Then, one by one, they all disappeared. Nobody decided visualizers were a bad idea. The players that owned the audio died, and the streaming apps that replaced them never picked up the torch. Here's the whole story.
The golden age: 1997 to about 2010
For a stretch of the late 90s and 2000s, watching your music was a normal thing computers did. Three players defined it:
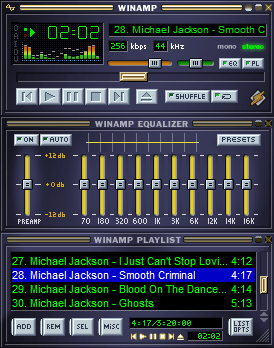
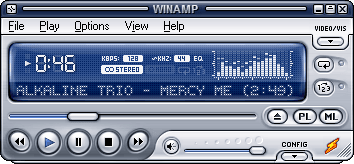
Winamp made visualization an art form. Its plugin system let anyone write a visualizer, and in 2001 Ryan Geiss's Milkdrop raised the bar so high it still hasn't been cleared: GPU-rendered, beat-reactive psychedelia driven by a community that wrote tens of thousands of presets.
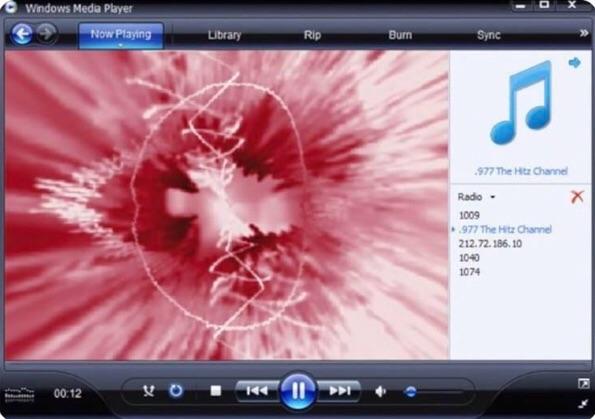
Windows Media Player put visualizations in front of the mainstream. Alchemy, Bars and Waves, Battery, Ambience: they shipped with Windows itself, so for millions of people a WMP visualization was the first one they ever saw.
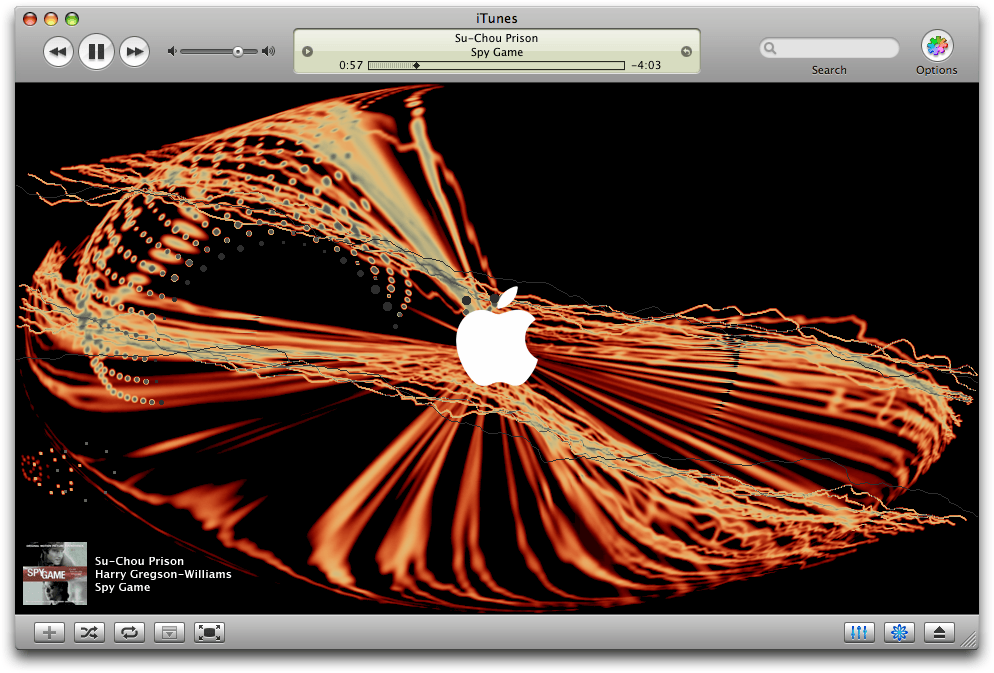
iTunes gave the Mac (and later Windows) its own house style, and in 2008 iTunes 8 shipped a stunning new default visualizer based on Robert Hodgin's Magnetosphere. You pressed Cmd+T, leaned back, and your library turned into weather.
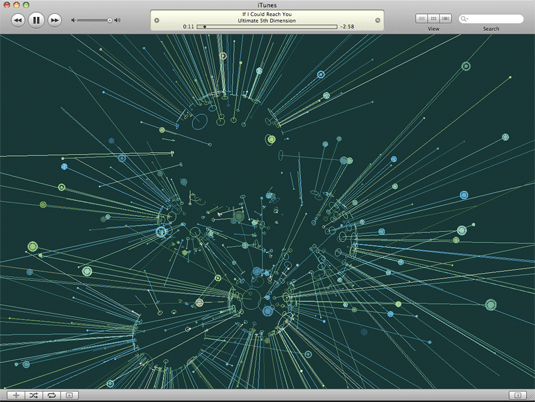
Then they all died
The removals happened quietly, each for its own reasons, but they all pointed the same way:
- Winamp faded through the 2010s as it changed hands from Nullsoft to AOL to Radionomy, each transition stripping away more of what made it special. Milkdrop survived only as open-sourced code (projectM, Butterchurn); the seamless play-and-watch experience went away with the player.
- iTunes was split into Music, TV, and Podcasts with macOS Catalina in 2019, and the visualizer did not survive the split. Two decades of iTunes visuals ended without so much as a mention in the keynote.
- Windows Media Player was sidelined for Groove Music, which had no visualizations; then Groove was killed for the Windows 11 Media Player, which also has none. The classic player still hides in Windows 11 as “Windows Media Player Legacy”, visualizations intact, but only for local files (here's how to find it).
- Spotify, the player most people actually use now, never had one to remove, aside from a short-lived easter egg around 2014 (the full story).
Why it happened
The plugin architectures died
The great visualizers weren't features, they were plugins. Winamp's visualization API and WMP's visualization DLLs let outside developers do the creative work. But native plugin systems became security liabilities and maintenance burdens, and modern software abandoned them across the board. When the plugin APIs went, the ecosystems built on them went too, and no first-party team was ever going to match what those communities produced.
Streaming apps don't own the audio pipeline
A visualizer needs the raw audio signal, decoded and flowing through code you control. Winamp and iTunes had exactly that: they decoded your MP3s themselves. Spotify and its peers are essentially web apps around a DRM-protected stream, built with interface frameworks that treat audio as something to route to the speakers, not something to analyze. Exposing the decoded signal to visual code is architecturally awkward and commercially uninteresting, so it never happened.
Mobile ate the interface
Music apps are designed phone-first now, and a phone screen during playback is a lock screen, a thumbnail, or a pocket. A feature whose whole point is a big screen you stare at didn't fit the design brief, and desktop apps became ports of mobile designs rather than the other way around. The closest modern gesture is Spotify's Canvas: artist-uploaded video loops that move, but don't listen.
Does anything still have a visualizer built in?
A few holdouts. VLC still ships basic visualizations and can embed projectM. Windows Media Player Legacy still works on local files. Some audiophile players like foobar2000 have spectrum displays through components. But every one of them shares the old limitation: they only visualize files they play themselves, and almost nobody's music lives in local files anymore. The big streaming apps, where the listening actually happens, have nothing.
Where visualizers went: the browser
The technology that killed the desktop music player eventually recreated what it destroyed. Browsers now have the two ingredients a visualizer needs: the Web Audio API for real-time frequency analysis, and WebGL for GPU rendering, the same class of horsepower Milkdrop used. Crucially, browsers can also capture system audio, the sound your computer is making, regardless of which app is making it. That one capability solves the problem that killed the category: a browser visualizer doesn't need Spotify's cooperation, or Apple's, or anyone's.
That's what vizz.fm is: a free, real-time visualizer that runs in your browser and reacts to anything your computer plays. Spotify, Apple Music, YouTube, local files, even a live microphone. GPU-rendered scenes in the lineage of Alchemy and Milkdrop, with every parameter tweakable and nothing to install. Browse the scenes to see where the art form went, or read the setup guide for capturing system audio (it takes about a minute).
Music visualizers didn't die because people stopped wanting them. Ask anyone who remembers Alchemy or Milkdrop what they think of when they hear “music visualizer” and watch their face. The feature just got orphaned when its hosts died. The browser adopted it.

Watch your music again.
The modern music visualizer: free, in your browser, reacting to anything you play.